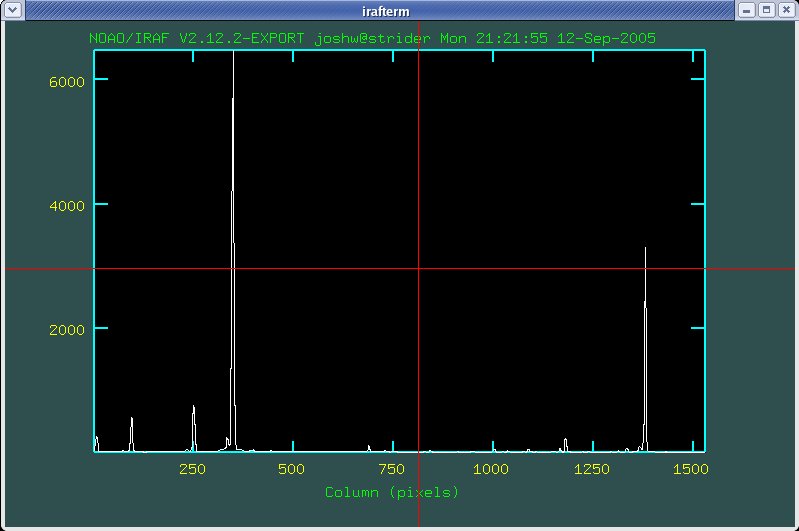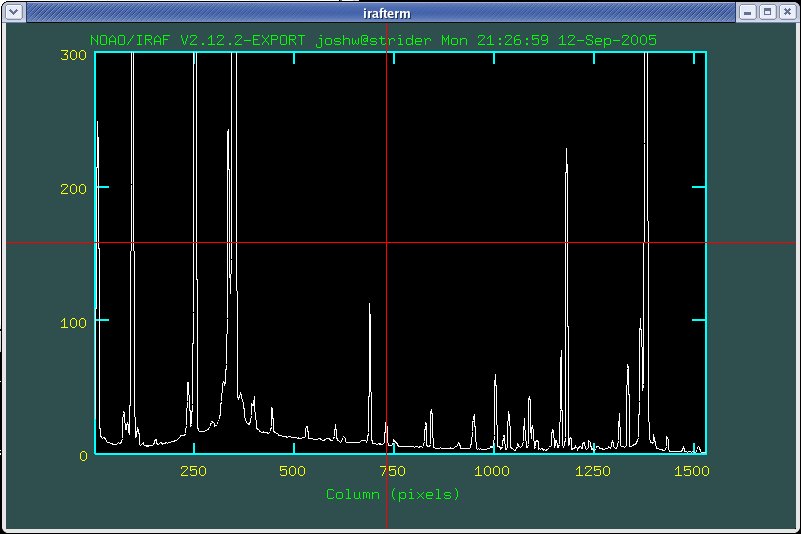
Fig. 9
With continuum spectra the apall task is an excellent
tool for extracting the spectra. When dealing with nebular spectra,
there is no nice trace for apall to lock on to. In this
case, more sophisticated methods (such as those described in A User's Guide to
Reducing Slit Spectra with IRAF, by Phil Massey, Frank
Valdes, and Jeannette Barnes) should be used. A simple method is
described here.
If your spectrum is aligned along the horizontal pixel axis, then
the obvious alternative to apall is to simply average
several lines together to generate a one dimensional image. If your
spectra is not aligned to the horizontal axis, simply use the
rotate task in IRAF to align it.
To combine the lines of the image into a single line (one
dimensional spectrum), we use the imcombine with the
appropriate input. In this case, rather than adding images, we want
to add lines. We do this using image subsections as described in
section IV. D of this tutorial. We need to create an input list in
which each input image is a line of the image we wish to combine.
I have written a simple UNIX code which automatically generates this list. You can download the file here (simply save the file to the directory you are working in or to a location in your UNIX path). After downloading the file, you'll need to make it executable by running the UNIX command:
% chmod a+x mkspeclist
The chmod command only needs to be run one time after
you download the file.
The proper use of mkspeclist is:
% mkspeclist imagename l1 l2
where imagename is the name of the image you wish to combine the lines of and l1 and l2 are the first and last lines of the image which should be combined. The program simply prints the list to the screen.
For example, here is what the output might look like:
% mkspeclist myspectrum 450 460

myspectrum[*,450]

myspectrum[*,451]

myspectrum[*,452]

myspectrum[*,453]

myspectrum[*,454]

myspectrum[*,455]

myspectrum[*,456]

myspectrum[*,457]

myspectrum[*,458]

myspectrum[*,459]

myspectrum[*,460]
Now you can copy and paste those lines into a test editor to
generate the list file. Alternatively, you can "redirect" the output
of mkspeclist to a file like this:
% mkspeclist myspectrum 450 460 > lines_myspectrum
Now if you open up the lines_myspectrum file, it will contain the 11 lines which previously were printed to the screen.
Now that we have our input list, we can combine lines using:
cl> imcombine @lines_myspectrum myspectrum_1D combine=average
Note that I have explicitly specified the combine to be an average (as opposed to a median), since we may be combining something that is not uniform in brightness, we shouldn't do a median.
The myspectrum_1D file is now a one dimensional fits file which
looks boring when displayed (it is one line of pixels). However, we
can use the IRAF task implot to look at it:
cl> implot myspectrum_1D
The resulting IRAF window might look something like Fig. 9:

The implot task has many interactive features which
can be useful. They are documented in the help page, but one I will
point out here is the ability to change the viewing window to "zoom
in" on a part of the image. For example, in this case, we can see
only a few really bright lines, but the lower level information is not
visible. To see the lower level info, I would like to change the
y-axis to show a different range. Right now it is showing something
like 0 to a little over 6000. To change it I would point at the plot
and type :y 0 300 (don't forget the colon). This
rescales it to a 0 to 300 y-axis. Now we can see some of the fainter
lines. The result can be seen in Fig. 10.

A similar command exists for the x-axis.
To sky subtract our spectrum (a task done automatically in
apall), we simply extract a second spectrum from a set of
lines in the spectrum which do not contain an object:
% mkspeclist myspectrum 480 900 > lines_sky
cl> imcombine @lines_sky myspectrum_sky combine=average
In this case the lines 480-900 contain only blank sky. In general it is best to combine as many lines as possible to drive down the noise that you add by subtracting the sky.
No we simply use imarith to subtract the sky spectrum:
cl> imarith myspectrum_1D - myspectrum_sky myspectrum_1D_skysub
Now the myspectrum_1D_skysub file is a one dimensional sky
subtracted spectrum of our source. Notice that in this subtraction
step, it was critical that our imcombine commands were
averages (instead of sums). If we'd summed, we could not simply
subtract the sky spectrum from the object spectrum since they
contained different amounts of sky (different numbers of lines).
Since we averaged, we don't have to worry about that issue.
You may now return to the previous page in the IRAF tutorial and continue with step H.